Unlock Your Data Potential

We help B2B companies capture and leverage relevant datasets—turning targeted info into actionable insights.

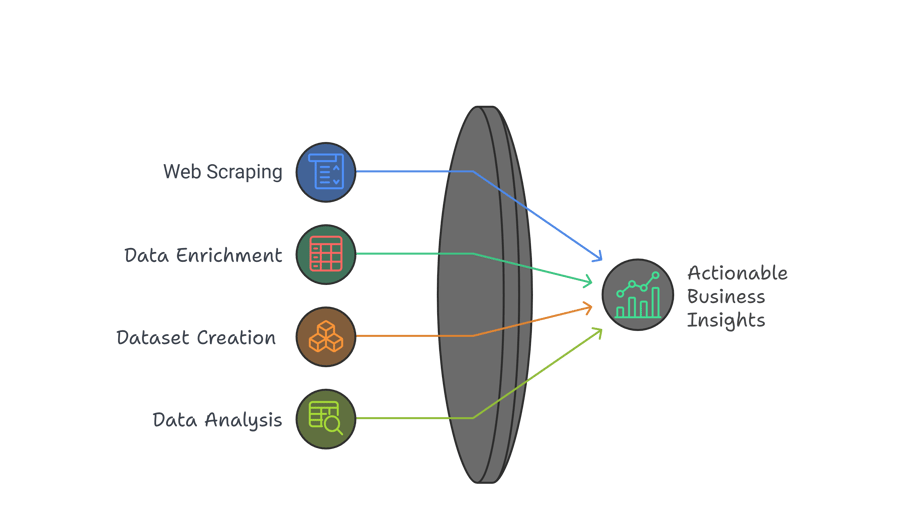
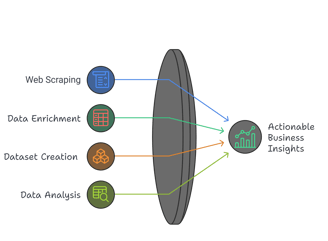
Transform Data into Value

Collect high-value web data at scale—compliantly and reliably.

Turn raw information into actionable insights that drive results.

Elevate existing records with accurate, up-to-date insights.

Craft tailored datasets aligned to your unique business goals.

Your Data Extraction Partner

At Scrape4You, we empower B2B companies to harness unique datasets through advanced web scraping technologies, transforming raw data into actionable insights for strategic decision-making.

A person is looking at a computer screen displaying a document titled 'Overview - All Private Equity - Fundraising, Investments, & D'. The document contains statistical charts and graphs related to private equity market statistics from 2007 to 2022. Various tabs and functions like 'File', 'Home', 'Insert', and 'Design' are visible in the interface.

150+

15

Trusted by Experts

Proven Solutions

Data Solutions

Transforming raw data into actionable business insights for clients.

A trade show booth featuring a large installation resembling a pair of oversized hands positioned above. The booth is branded with the name 'BOWA' and several display cases with products are illuminated in the background. Several individuals are present, engaging in conversation and looking at the exhibits.
Custom Integrations

We provide tailored solutions that seamlessly integrate with your existing systems, enhancing data accessibility and usability for informed decision-making and strategic planning.

A promotional banner with a bold red background features the text 'Data has a better idea' in large white letters. Above the text, the word 'HIVERY' is printed along with a stylized logo resembling a beehive. The background also includes a pattern of blue circles and dots, giving a digital or technological feel. In the surrounding area, there's a partial view of a desk and some office supplies.
Data Enrichment

Our data enrichment services enhance your datasets, providing deeper insights and improving the quality of information for better business outcomes and competitive advantage.

Scrape4You transformed our data strategy, providing invaluable insights that drove our business forward.

John Doe

A computer screen displaying analytics dashboards with various charts, including a line graph on the left and a cohort analysis table on the right. The table is populated with different shades of blue, indicating varying levels of user activity over several weeks. Text labels and numbers detail user retention statistics.
A laptop with an open screen displaying dashboard analytics featuring charts, graphs, and numerical data related to sales and subscriptions. The interface is predominantly dark-themed with sections highlighting key performance metrics. The device shown is a MacBook Pro, indicated by the keyboard layout and branding.

★★★★★